
Make Your AI Auditable
BluelightAI Cobalt opens the black box, turning opaque, high-stakes decisions into clear concepts your team can improve.
Building with AI?

TRUSTED BY


Verify what’s happening inside your model.

Cobalt is an interpretability engine that makes model behavior visible. Instead of guessing from outputs, your team can see how decisions are made and confirm the model is working as intended.
Detect anomalies topologically.
Using topological data analysis, Cobalt establishes a structural baseline for model behavior and detects deviations, signaling when and where intervention is needed.
Build reliable guardrails.
Cobalt gives teams continuous oversight of model behavior, enabling guardrails to be defined, monitored, and adjusted with confidence as systems evolve.
How teams use Cobalt
Two common starting points for high-stakes AI systems:
1. LLM Risk and Behavior Assessment
We run Cobalt on your model, using a sample of your own data, to reveal how the model behaves under real world conditions. We surface risks, blind spots, and patterns to investigate.
Written assessment summarizing key findings
Interactive Cobalt views of internal behavior
A clear baseline for future comparison

2. Decision Pipeline Deep Dive
We focus on a single high-impact decision process, such as claims triage or complaint escalation. Cobalt shows which components drive outcomes and where behavior is misaligned.
Feature-to-decision mappings
Identification of risky or unintuitive behavior
Clear opportunities to strengthen guardrails

“This is a map of an LLM’s mind.”
– Jakob Hansen, Head of Data Science
-
Modern AI systems can perform well while still behaving in ways that are difficult to predict, explain, or control. Mechanistic interpretability provides visibility into why decisions are made, enabling teams to diagnose failures, assess risk, and apply meaningful human oversight.
Without interpretability, teams are left reacting to symptoms rather than understanding root causes.
-
Cobalt is designed for teams deploying AI in high-stakes environments where understanding, accountability, and control matter.
This includes AI developers, operations teams, and risk and compliance stakeholders working in regulated or safety-critical settings such as banking, insurance, healthcare, government, and enterprise decision systems. In these contexts, strong performance alone is not enough. Teams need to understand why decisions are made, ensure behavior aligns with intended use, and demonstrate that decisions are auditable and defensible.
Cobalt turns opaque model internals into clear, verifiable concepts, giving organizations the confidence to trust, explain, and improve AI-driven decisions before issues surface in production.
-
Cobalt enables teams to understand unexpected behavior, identify failure modes, detect spurious correlations, and surface patterns that traditional evaluations miss. These insights support more informed audits, targeted improvements, and safer deployment of AI systems.
The goal is to understand why behavior occurs before deciding how to intervene.
-
Topological data analysis reveals structure in complex, high-dimensional data without requiring predefined labels or assumptions. When applied to AI model internals, it makes it possible to surface patterns, clusters, and transitions that traditional metrics and evaluations often miss.
This empowers teams to discover unexpected behaviors and failure modes early, and to explore model behavior across multiple levels of resolution rather than relying on fixed tests alone.
-
Cobalt uses Cross-Layer Transcoders (CLTs) to identify features that persist and interact across multiple layers of a model.
Rather than treating each layer in isolation, CLTs link activations across layers into coherent features that better reflect how information flows through the model. This makes them particularly useful for circuit-level analysis and causal tracing.
-
Cobalt uses Sparse Autoencoders (SAEs) to extract interpretable features from a model’s internal activations.
Modern language models operate in high-dimensional spaces that are difficult to inspect directly. SAEs allow Cobalt to decompose these activations into a large set of sparse, reusable features that correspond to internal concepts the model relies on during computation.
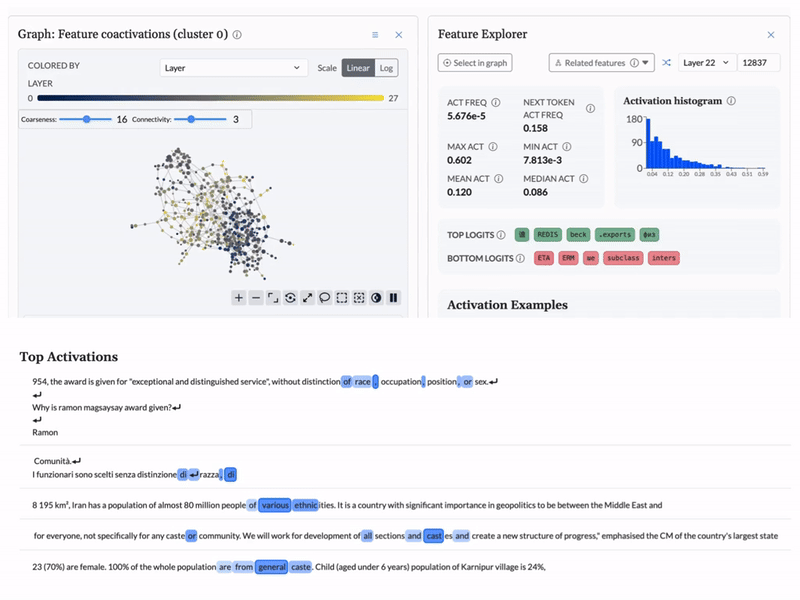
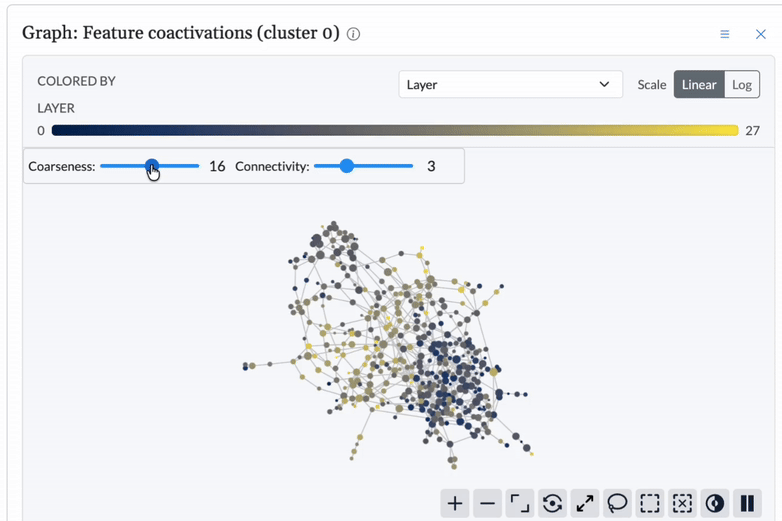
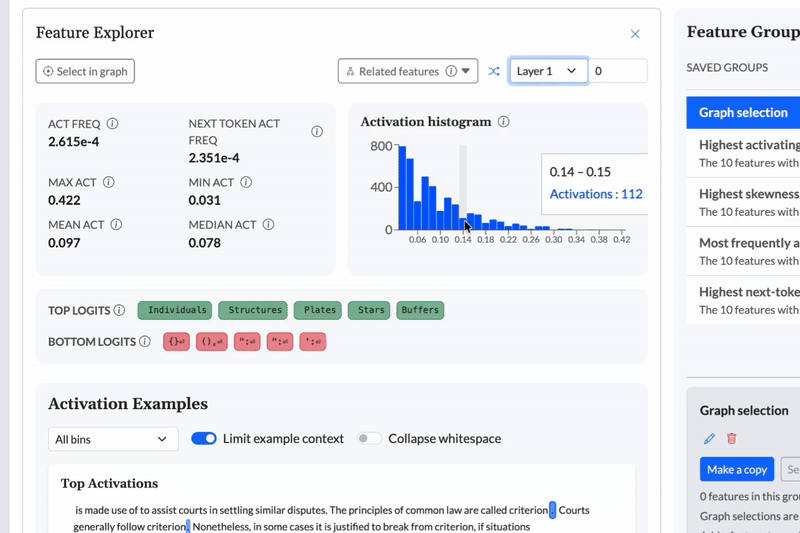
LLM Explorer
As a concrete demonstration, BluelightAI built this LLM Explorer: an open, interactive environment for inspecting the internal representations of the Qwen3 family of models via cross-layer transcoders and topological analysis.
This explorer shows how Cobalt can be applied to real, production-grade models to surface features, structure, and behavior that are otherwise missed.
Blog


Deploy AI with Confidence.

Operational Intelligence

Risk Mitigation

Regulatory Compliance


Contact Us
Interesting in building with Cobalt?